The result
Shipped, shared across teams, and used more than what it replaced.
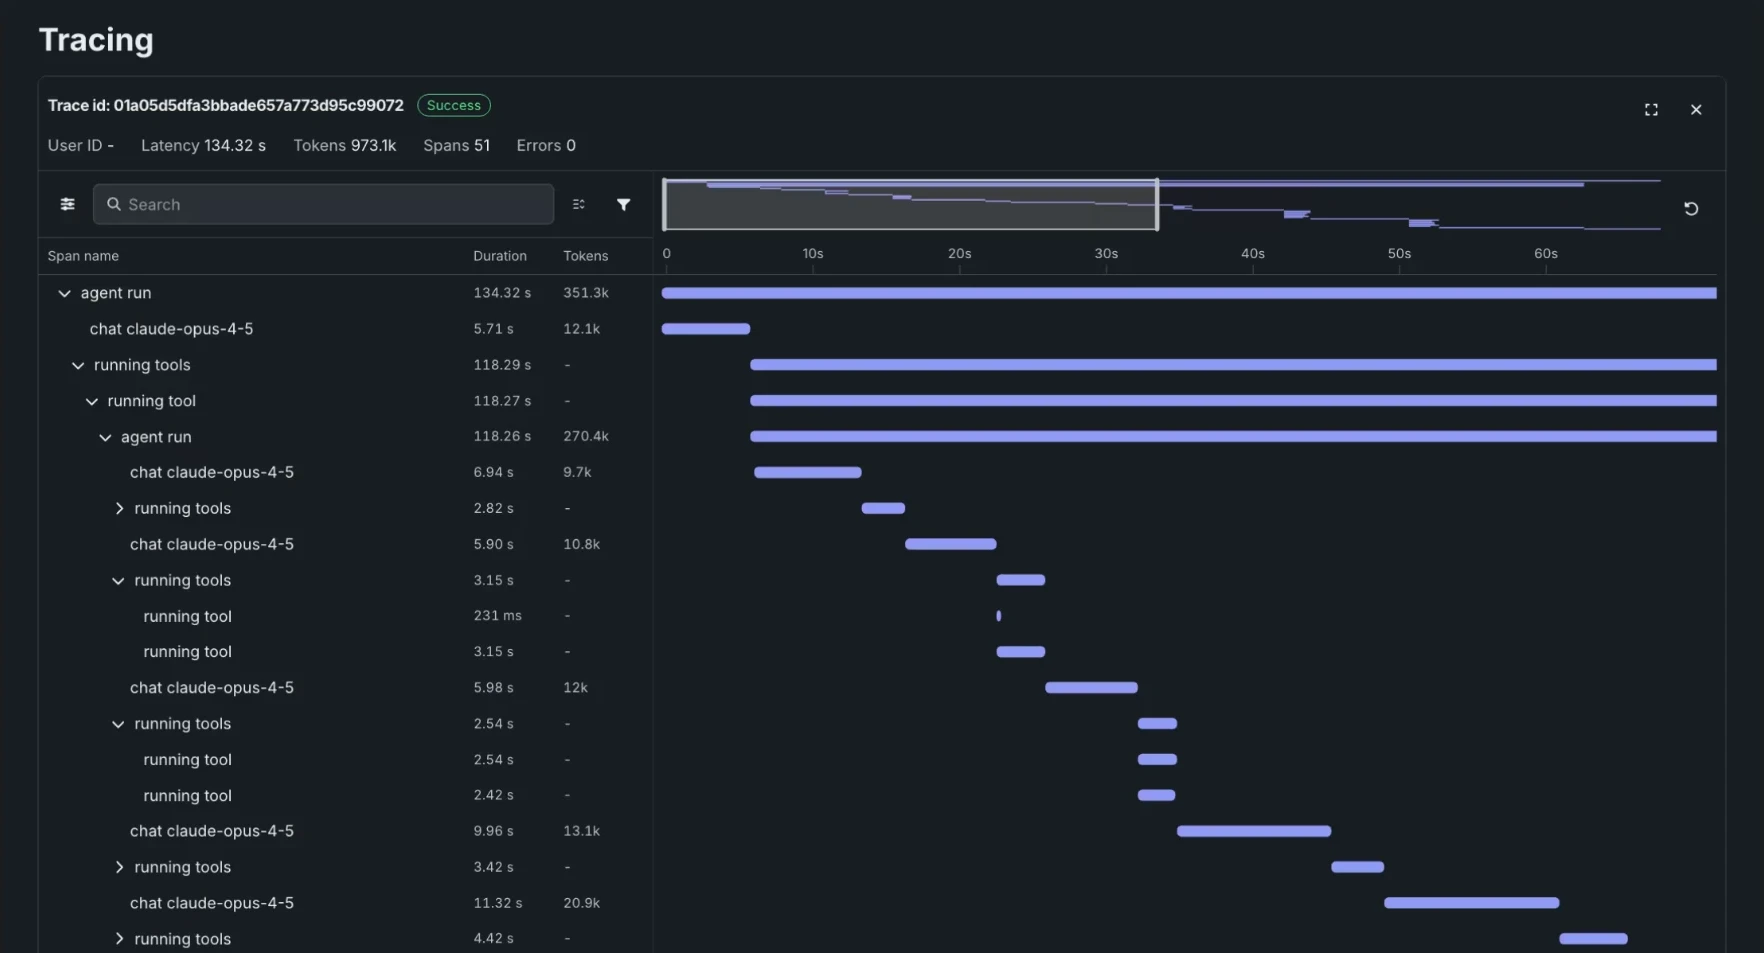
OpenTelemetry-based tracing replaced Data Quality, the earlier view built for classic ML, and shipped as one component for both monitoring agents in production and building them code-first. I led its design from the first prototype to launch.
See tracing in the DataRobot docs
-
Page visits up 29%
Within a year of OTel-based tracing replacing Data Quality, the earlier view built for classic ML.
-
One component, many places
Shared across teams, in production monitoring and code-first agent building.
-
Validated with 23 practitioners
With no training on the product, all 23 found the cause of an error on their own, and were confident, 4+ out of 5 on average, that they could do the same with their own agents.
The problem
An agent can fail in dozens of places, and the trace shows all of them at once.
A single agent run calls models, retrieves data, runs tools, and calls other agents. Each step is a span, and a trace can hold dozens of them. When something goes wrong, the answer is in there, but it’s buried: in a deep tree of spans, in raw inputs and outputs, and in logs.
I first designed tracing for GenAI, to show how RAG workflows reached their answers. As the platform moved to agents, tracing grew with it: first for agents running in production, then inside the agent building workflow. So it had to serve two journeys: people building an agent and checking why it misbehaves, and people debugging an agent that’s already running in production.
Building an agent is never one pass. What people learn at each stage sends them back to an earlier one, and tracing gives them the evidence to go back.
Define Build Evaluate Deploy Observe
Inner loop
Minutes · Evaluate back to Build
Local runs, local evals.
Trace: inspect steps, diff runs.
Guardrail loop
Hours · Observe back to Build
Blocked or risky runs become updated rules.
Trace: flagged spans.
Evidence loop
Days · Observe back to Evaluate
Production data becomes eval datasets.
Trace: failed runs become eval cases.
Fix loop
Days to weeks · Observe back to Build
New version, redeploy, watch.
Trace: find the failing span, compare before and after.
Scope loop
Rare, expensive · Observe back to Define
Docs and meetings.
Trace: trends justify rescoping.
My role
One tracing experience, used by many teams.
Tracing was built as a shared component, so every design decision had to work for each team that used it.
- I owned: the tracing experience end to end, including the competitor analysis, the coded prototype and the research.
- I influenced: what we built first, and the backlog for the next iterations.
The approach
Familiar for developers, built for agents.
Tracing isn’t new. Developers already know it from tools like Langfuse, Arize Phoenix, Chronosphere and many others. Ours is built on OpenTelemetry, the open standard for traces. I started from a competitor analysis, so we kept what already works and users didn’t have to relearn it.
But agent tracing behaves differently. A regular service follows a known path, so its traces look much the same every time. An agent decides its next step as it runs: the same request can take three steps once and seven the next, call different tools, and produce different kinds of spans, each with its own attributes.
So I kept the core pattern, a tree of spans on a shared timeline plus span details, and adapted it for agents:
- Details that fit each step: LLM calls, tool calls and nested agents each show the attributes that matter for them, instead of one fixed set.
- AI metrics next to duration: tokens, context and cost sit beside timing, so people can see what the LLM was given at every step.
- A structure that holds any path: the tree and timeline make sense of whatever route the agent took, without expecting the same shape every time. Span details share one skeleton that fits any span, even when each type shows different attributes.
Trace view
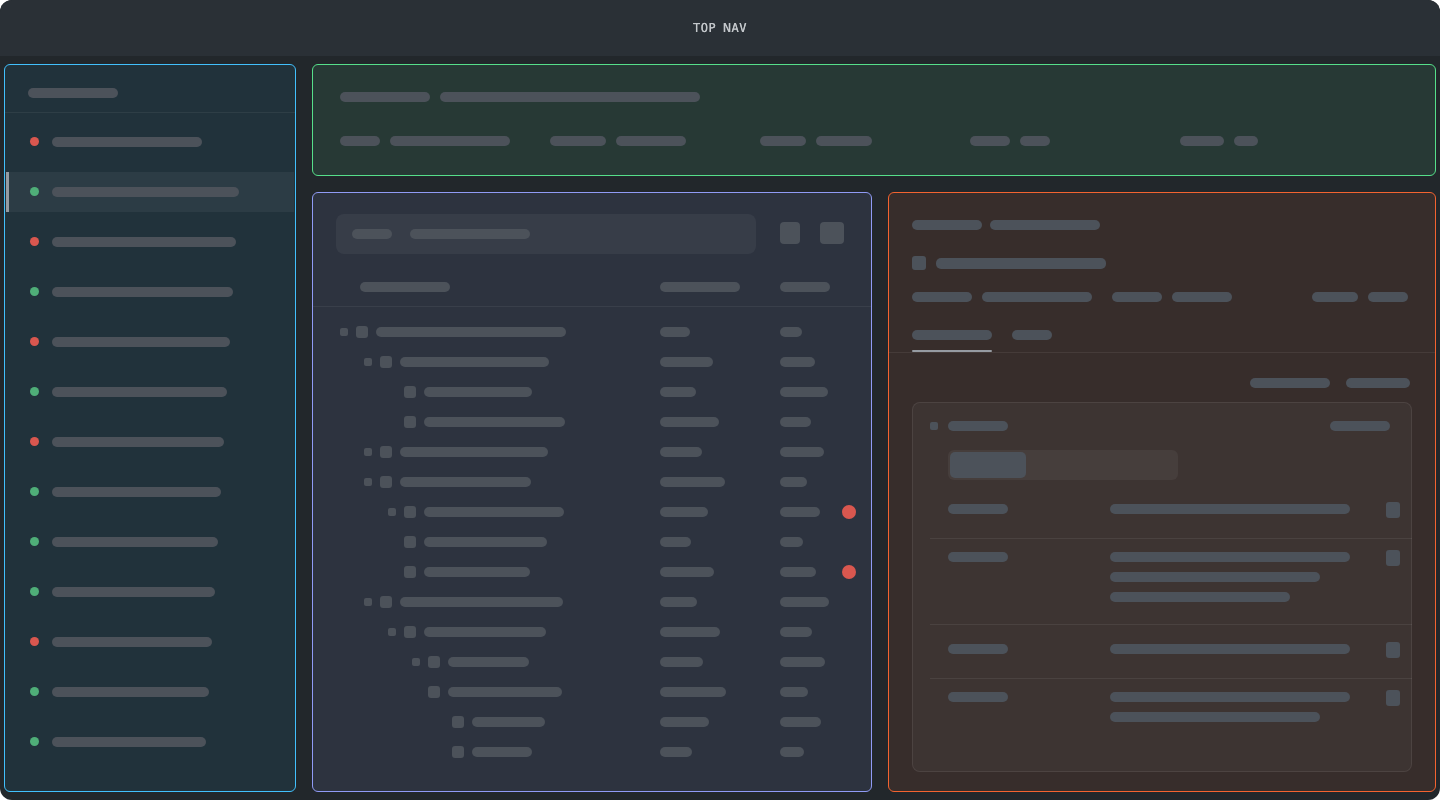 Find the trace
Narrow down to the span
Explore the details
- Trace listEvery run with its status, so failed ones stand out before opening anything.
- Trace overviewStatus, duration, tokens, spans and errors, to judge the run at a glance.
- Span treeThe structure of the run, with duration and tokens on every span and failing spans flagged.
- Span detailsAttributes and logs for the selected span, in one skeleton that fits any span type.
I built an interactive prototype in Claude Code to test these changes: we could implement a change fast and check with internal experts whether it solved their problem. People could click through realistic traces on their own, which made feedback faster and more honest than static mockups.
The research
The information wasn’t missing. People had to dig too far to reach it.
I ran the research in two rounds. First, moderated sessions with internal experts: we fixed the obvious issues and addressed customer feedback. Then, an unmoderated study with 23 external, hands-on practitioners: mostly AI and ML engineers, some building agents in code and some mixing code with the UI. The second round checked one thing: could people with no training on the product find their way around tracing and act on a failure? Both rounds covered the same full flow: the traces list, the span tree, and span details.
The study combined three methods, each followed by questions. Click tests showed where people expected to find information, an open card sort showed how they group a span’s attributes, and free exploration of span details went deeper.
Practitioners.
External, hands-on technical users.
Research rounds.
Moderated with internal experts, then unmoderated with external users.
Methods.
Click tests, card sorting, free exploration.
The study confirmed the investigation path people took: find the trace, narrow down to a specific span, find the cause of the failure or delay, then move on to debugging. Everyone could identify the root cause of an error, and on average they rated their confidence 4+ out of 5 that they could diagnose a similar issue in their own agent. But the sessions also showed how much digging it took to get there.
Find the trace.
Narrow down to the span.
Find the cause.
Debug.
The card sort brought a surprise. People didn’t agree on one way to group a span’s attributes, and it wasn’t confusion: the right group depended on the task, whether they were thinking about the AI call, the service, or the trace itself. Inputs and outputs grouped easily, while system and workflow attributes had no stable home.
Together with the feedback from both rounds, this set our priorities. The first three shaped tracing; the last is what we planned to build next:
- A strong overview at the trace level, so people can judge an agent’s health from the list and decide where to go next.
- Extensive filtering and search: by duration, span count, attributes and more.
- A clear view of what failed and why: error highlights, clear descriptions, logs and span details.
- Performance at a glance: success and error rates, trace counts, average duration, and how latency and errors trend over time.
The design
Show enough at each step to choose the next one.
Find the trace
The traces list has to let you pick the right run without opening several. It shows each run’s status, number of spans, duration, tokens, cost, and user, with filters to narrow down to the runs that matter, and failed runs stand out before you open anything. In testing, the list was great for spotting which runs failed, but people still had to open them to find out why. So we surfaced more details right in the list.
Traces list
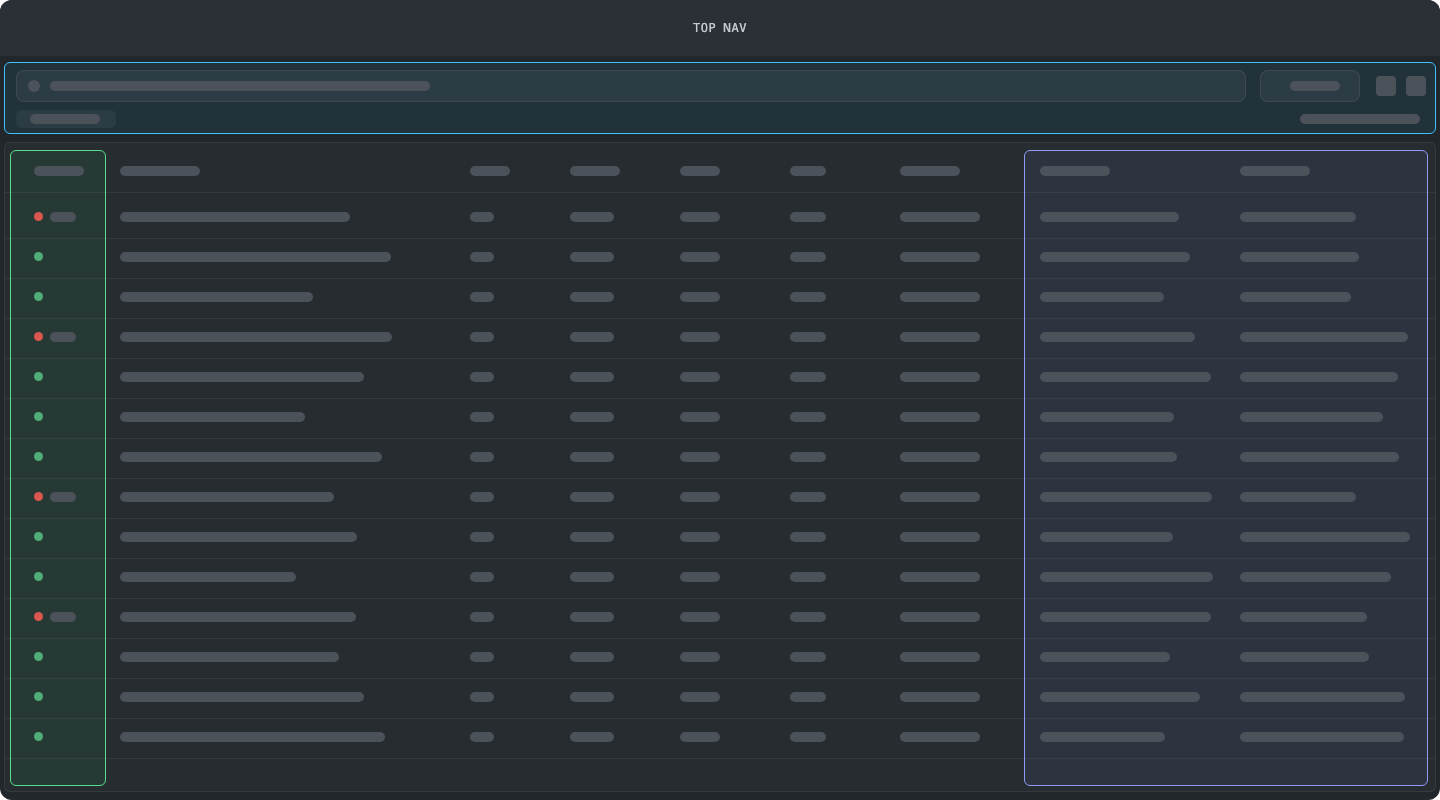
- Filters and searchNarrow the list down to the runs that matter.
- StatusFailed runs stand out before opening anything.
- More in the listDetails surfaced in the list, so nobody hunts for them elsewhere.
Narrow down to the span
Inside a trace, you should be able to pick the right span without expanding the whole tree. In testing, people got there, but only after digging through it. So the span tree keeps the structure of the run, with duration and tokens next to every span and failing spans flagged right in the tree. The trace header shows how many errors there are before you scroll, and search and filters jump you to the spans you need. A timeline beside the tree shows when each span ran, so the one that took the most time stands out.
Trace view
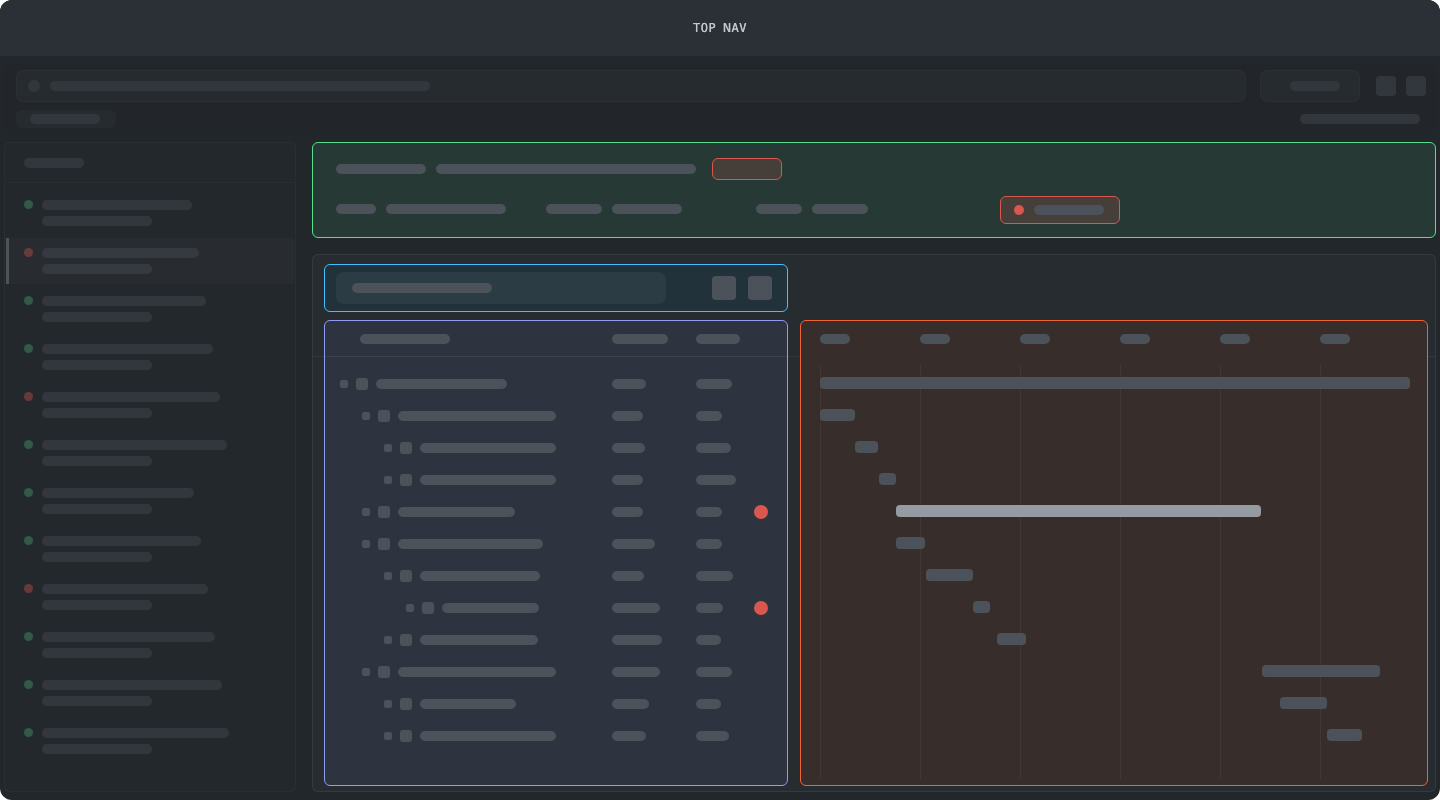
- Trace headerHow many errors the run has, before you scroll.
- Search and filtersJump straight to the spans you need.
- Span treeDuration and tokens on every span, failing spans flagged in the tree.
- TimelineWhen each span ran and for how long, so the slowest one stands out.
Find the cause
In a span, you should find the right attribute without scrolling through all of them. Selecting a span opens its details beside the tree, so you can read what the step was given and what it returned without leaving the trace. The card sort showed there’s no single right way to group a span’s attributes: it depends on the task. So inputs and outputs, which everyone grouped the same way, get their own sections, and everything else sits in one flat, searchable list. Logs have their own tab.
Span details
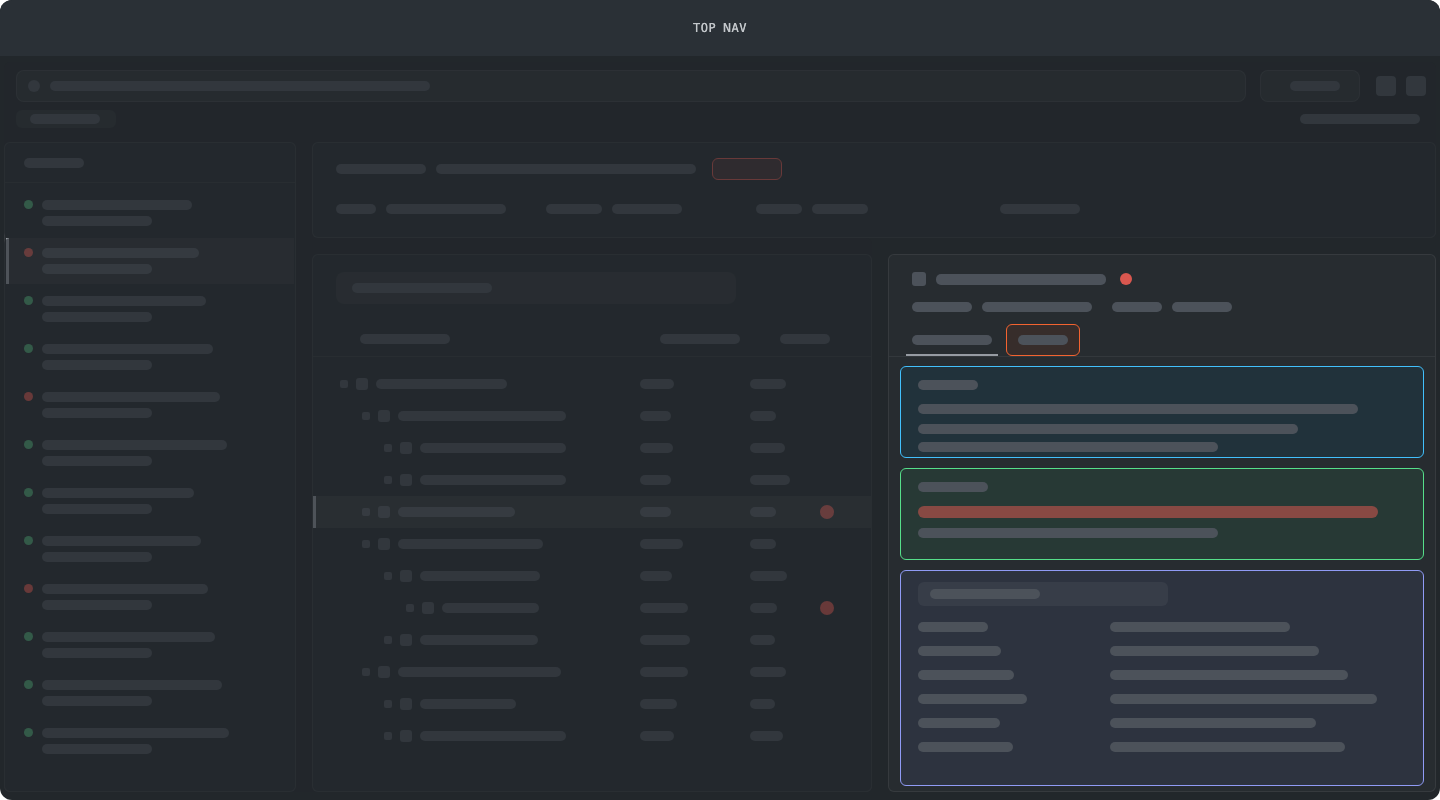
- InputsWhat the step was given, in its own section.
- OutputsWhat it returned, with the error highlighted.
- AttributesEverything else in one flat, searchable list.
- LogsIn their own tab, one click away from the attributes.
Back to the fix
A trace shouldn’t end at “found it”. Each span links back to where it came from: the agent component that ran it, like a tool, or the marked piece of code in the logs. When a span fails, that link takes you straight to what needs fixing. So the investigation ends where the fix starts, back in building.
We didn’t re-run the study after these changes. Feedback from customers and internal teams was positive, and page visits grew 29% over the following year.
Try it yourself
Below is an interactive prototype that follows the same path: find a trace, narrow down to the span, find the cause. The Try this button in its header gives you five small investigations, like finding out why a refund failed.
This isn’t the shipped product. I rebuilt a reduced version of the tracing work from scratch for this portfolio, with its own look, generated sample data, and a smaller feature set. It shows the kind of work I did, not the exact screens.
The prototype works on larger screens.
It’s built for a desktop browser, like the tools it illustrates. Open this page on a laptop or desktop to try it.
What’s next
From one trace to the health of every agent.
Tracing is one of the tools that help people understand how their agents are doing, and take what they find back into building to improve them. Today it covers the inner loop and the fix loop: one run, one failure, one fix. The next step serves the slower loops, where patterns across many runs feed evals, guardrails and scope. It widens the view to a helicopter view of agent health across many runs in production, so problems show up before anyone digs into a single trace.
One trace.
Where people debug today.
Many runs.
Patterns across them.
Agent health.
Problems seen before digging in.
Reflection
Ask people, then design for where they agree and where they don’t.
The card sort taught me to treat disagreement as an answer. Where people agreed, we committed to a structure. Where they didn’t, the design left room instead of picking one view.
Tracing had to make sense in both places it lived: while building, and in production. Designing one component for both kept us from optimizing for one.
Prototyping in code let us put ideas in front of people in days instead of weeks. Next time I’d bring production monitoring users into the study earlier.